Cartels raise prices and thus procurement costs substantially and are notoriously difficult for most organizations to identify. Given the impact of hefty fines and damaging publicity, cartels have become skillful at hiding their activities.
This article summarizes how you can use graph theory along with other indicators to analyze the structure of the observed competition and identify conditions conducive to cartel formation.
Introduction
Cartels are not a new concept. In The Wealth of Nations (1776), Adam Smith noted:
„People of the same trade seldom meet together, even for merriment and diversion, but the conversation ends in a conspiracy against the public, or in some contrivance to raise prices.“
What is a cartel?
A cartel refers to an organized, often illegal cooperation between competitors.
Cartel organizations can increase their profits by setting prices collectively, dividing market shares, or agreeing on bid-rotating schemes.
On average, cartels lead to a 22% to 25% price increase for the procuring organizations.
While governments often oversee the discovery and penalization of cartels, private companies have started to increase their efforts to screen for cartels.
What are the benefits of automated cartel screening?
There are several benefits associated with a data-based, automated cartel screening approach:
- Identifying cartels can increase revenue through litigation, compensation payments, and lower future prices.
- A high likelihood of cartel presence can inform procurement managers to increase competition and decrease cartels‘ power.
- A.I.-based screening may deter suppliers from forming cartels when they know about the screening.
- Automated screening increases efficiency and lowers manual workload.
Once a screening mechanism has identified a likely cartel, there are strategic and tactical concepts that procurement can apply to weaken the negative effect of cartels.
For example, here at Competitio, we have designed game-theoretic procurement negotiations that have broken up cartels and reduced prices by up to 40%.
Note: To learn more about Competitio and our game theory services, please click here.
Cartel Screening Mechanics
Cartel screening relies on indicators to measure specific elements of the bidding process. For example, you could calculate the variance of the submitted bids.
Multiple studies have found that price variance generally decreases when cartels are present. An explanation could be that the coordination between cartel suppliers leads to converging prices as suppliers internalize the coordinated bid of the designated winner as a focal point.
The variance indicator flags a tender as suspicious if the variance is below a predefined threshold.
Most screening approaches rely upon bidding data. However, overreliance on price and bidding data can lead to correlations between screens.
Correlation is a statistical concept that measures the extent to which pairs of variables move in coordination. When indicators are strongly correlated, the additional indicators do not deliver much extra information. So ideally, you would look for uncorrelated sources of information. When multiple uncorrelated indicators simultaneously confirm the presence of a cartel, the analysis has increased validity, and the likelihood of having detected a cartel is high.
What are the different types of cartel screens?
Generally, there are behavioral, structural, and other types of cartel screens (see here, for example).

Bids submitted in a first-price sealed-bid auction or participation in a tender are the primary input for behavioral screens. There are also specific screens for dynamic auctions.
Cartel screening based on graph theory
Graph theory is a mathematical method to analyze the structure of networks. Networks consist of nodes (also: vertices) and edges connecting them. Graph theory can help derive optimal routes in the traveling salesman problem, and graph databases allow for fast and intuitive queries. Graph theory also has applications in deep learning, where graph neural networks (GNN) have analyzed social networks and helped model financial risk.
Graph theory-based cartel screening approaches are an underutilized, complement to behavioral or industry-specific structural screens. They do not require price data and thus are less likely to be correlated with behavioral screens. A graph theory-based cartel screen generally only requires information about the observed competition.
The emergence of cartels and screening criteria for the co-bidding network
In 1980, Professor Robert Axelrod started a tournament of game-theoretic algorithms that employ strategies for competing in a prisoner’s dilemma to analyze under which circumstances cooperation is likely to emerge. One of the study’s key results is that cooperation under adverse circumstances (the prisoner’s dilemma) appears more frequently when players repeatedly interact in closed groups, where the behavior of the other parties is observable.
This result translates to cartel formation, which is a form of cooperation under challenging circumstances. Cartels are more likely to emerge when the same group of suppliers repeatedly bids with few or no changes in their structure, and the competitive behavior of the other participants is observable.
Johannes Wachs and János Kertész have recently proposed a two-fold process to assess whether the structural properties of the market are conducive to cartel formation.
The first step is identifying groups of suppliers in the co-bidding network based on a community detection algorithm. The co-bidding network displays all suppliers that bid on the same contracts.
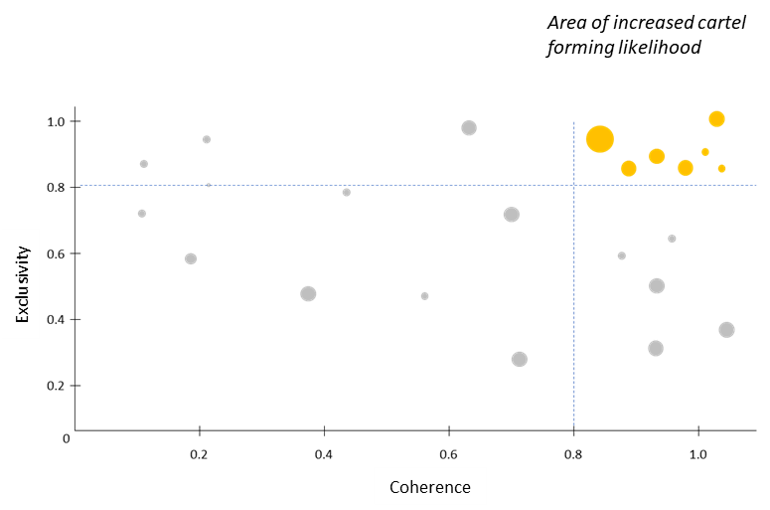
The second step is to evaluate suppliers‘ identified groups/communities based on two metrics, coherence and exclusivity. A group has a higher level of coherence when the connections between suppliers are equally distributed. It has a high exclusivity when it has few or no ties to suppliers outside of its group. When both metrics have elevated values, the likelihood of cartel formation is increased.
The screen generally performs well in practice. It has particularly strong predictive power when you combine it with behavioral screens, as this approach combines multiple sources of uncorrelated information.
Implementing graph theory screening
A cartel screen based on graph theory is convenient because it requires less calibration than behavioral screens. However, it identifies circumstances conducive to cartel formation, but it does not reveal cartel behavior. Therefore, you should use it to complement behavioral screens, time-series analysis, or other structural screens.
To apply graph theory analysis to procurement data, you need to have data on contracts and all suppliers that were invited or submitted bids for that contract. Contrary to other indicators, the tender type is not relevant to the analysis; it does not matter whether suppliers submitted proposals in an English auction, if the procurement department negotiated prices bilaterally, or if you applied advanced game-theoretic negotiation formats. For the co-bidding analysis, only the structural properties of competition matter.
We have supported several customers in designing and employing cartel screening on large and heterogenous procurement data as a one-off and automated monitoring process.
For further information, please send us an email to get in touch with one of the founders of Competitio.